
A government agency established in 1933 to refinance homes affected by the Great Depression left a legacy of segregation in communities around Citrus College. The Home Owners’ Loan Corporation recruited appraisers to survey land for development and mortgage lending.
Agency surveyors also focused on another factor – residents’ race.
“This is an old area which was developed as a Mexican district,” a surveyor’s report says about South Azusa. “Improvements are substandard. Many of them being nothing but shacks.”
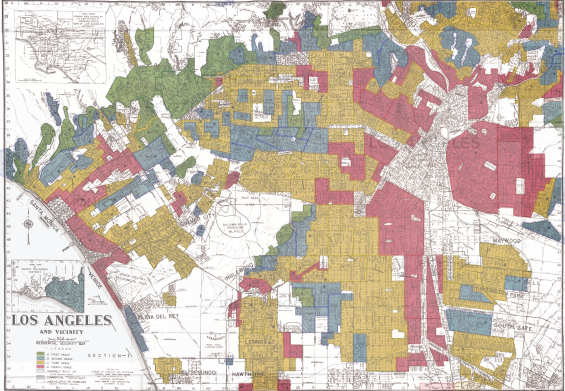
Historical documents compiled by the University of Richmond’s “Mapping Inequality Project” show how extralegal segregation divided communities across Los Angeles County. The practice was known as redlining.
Like parts of south Glendora, South Azusa is illustrated in red and deemed “hazardous” to underwrite mortgages.
Grading and color-coding U.S. neighborhoods was practiced across the nation. Districts receiving low ratings correspond with mortgage value disparities today across the Los Angeles County.
Public officials contacted by the Clarion in Azusa, Covina and Glendora were unaware of the practice in communities where the majority of Citrus College students reside.
Glendora council member and real estate broker Gary Boyer called linking historical inequality to the present “odd” and a “stretch.”
“When you think about racial tensions today, my personal opinion, I think the first step to easing racial tensions in this country – stop asking,” Boyer said. “Well, we want to learn from history, but we don’t want to look back at history and say, ‘are we still racist today for something that happened in 1930?’”
Another research project that compiled and analyzed HOLC maps, the Testbed for the Redlining Archives of California’s Exclusionary Spaces, shows the HOLC maps overlaid onto a current map of California.
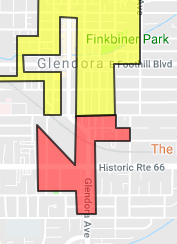
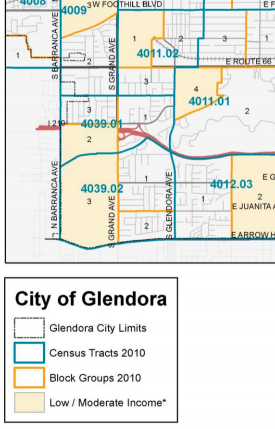
Glendora’s Director of City Planning Jeff Kugel referred to the redlined area as the “corner of Glendora and route 66.”
“The areas that are low income…do not appear to correspond with the redlining map from the 1930s,” said Kugel in an email. “The current low income areas are census blocks 4012.03 block group 2, 4039.02 block groups 2 and 3, and 4011.02 block group 1.”
However, the maps do correspond.
The 2010 census tract map shows that the redlined area covers the same areas that Kugel identified.
Kugel was asked about the relationship between the maps but has yet to respond.
The Glendora City Planning Department’s report from April 2018 titled, “Analysis of Impediments to Fair Housing Choice,” says that economic and demographic disparities still exist.
“… Black (29 percent) and Hispanic (25 percent) households had a higher proportion of lower income households than White (20 percent) and Asian (13 percent) households,” the report says. “Certain parts of the City have a disproportionate number of lower income minority residents.”
Past redlining explained
Color distinctions from security maps strongly correlate with the ethnic demographics of neighborhoods.
Citrus College geography professor Ryan Woolford explained that green “indicated the newer more expensive neighborhoods to the north and west” of Glendora.
“These areas were known at the time to be majority white neighborhoods,” Woolford said.
The Testbed for the Redlining Archives of California’s Exclusionary Spaces shows that red areas were “characterized by detrimental influences in a pronounced degree, undesirable population or infiltration of it.”
Areas inhabited by minorities were redlined and deemed “hazardous.”
Redlining and racial segregation in Glendora and Covina
Neighborhoods in Glendora were also redlined, which discouraged mortgage lending in minority-populated areas.
On a security map, the red area marked D18 was predominantly inhabited by Mexican Americans in 1939.
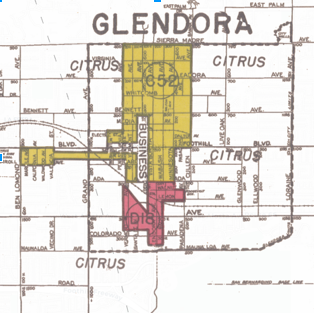
“This old area was developed as the Mexican section of Glendora and all inhabitants of that nationality are confined to this district,” the HOLC report states. “Construction runs from ‘shack’ to substandard…The area is a hazardous one and is assigned a ‘medial red’ grade.”
The yellow shaded area of the Glendora map provides more insight into housing practices.
It reads as follows: “This area covers the entire town of Glendora, except the section allotted to the Mexican population and to which they are rigidly confined.”
Covina’s summary in HOLC documents describe an unwritten racial code.
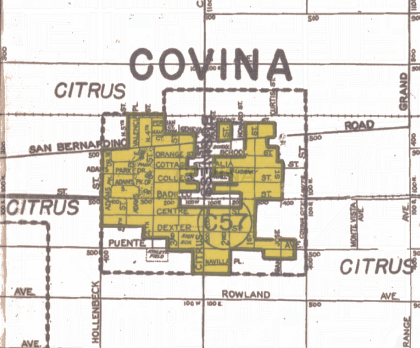
“There are no Mexicans in this community and there is an unwritten law prohibiting their presence.”
Because of its discriminatory nature, redlining was outlawed in 1968 with the passage of the Fair Housing Act.
However, in March of 2018, the National Community Reinvestment Coalition – an organization dedicated to building wealth in underserved communities – reported that the effects of redlining are felt today.
In their executive summary, NCRC found that redlining had the effect of denying minority communities “access to capital investment which could improve the housing and economic opportunity of residents.”
An investigation by Center for Investigative Reporting and Reveal showed that African Americans, Latinos, Asians and Native Americans pay higher loan interests and are denied conventional mortgages at higher rates than whites across the nation as recently as 2016.
The report, titled “For people of color, banks are shutting the door to homeownership,” examined 31 million housing records from 2015 and -16.
Redlining and the Citrus College connection
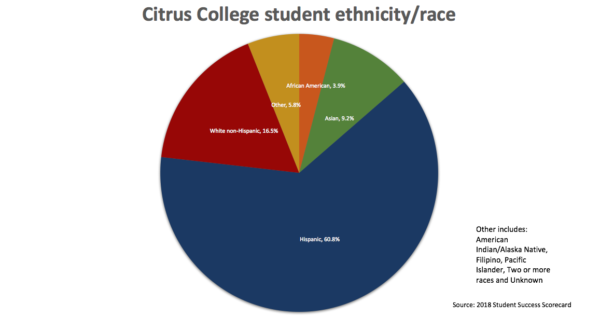
Citrus College’s student body is about 61 percent Hispanic or Latino.
Many of these students come from the surrounding communities of Glendora, Covina and Azusa that were affected by past redlining practices.
ASCC president Fernando Flores said he was concerned about the issue and its prevalence in the U.S.
“Slavery was legal, segregation was legal; legality is not a guide for morality,” Flores said.
Flores said that segregation still exists because “we are not born on equal ground” with equal access to resources and equal access to expression.
Director of the City Planning in Covina Brian Lee was unsurprised to learn that redlining was practiced in the area.
“There were prejudicial practices back in the day,” Lee said. “We did a lot of messed up things to people. We interned the Japanese.”
But reasons for Covina’s current demographic makeup are more complicated.
“There isn’t a one-size fits all answer,” Lee said. “The cost of housing, access to housing, market forces that exist, shifting demographics and also the shifting economy and historical influences – put all of that in a blender and you get what we have today.”
“I was not aware of that practice, but I’m not surprised,” said Manuel Muñoz, Azusa’s Associate City Planner.
Muñoz said that South Azusa was historically Hispanic and showed signs of racial and economic segregation. He said that demographics have changed over time to where it is more ethnically diverse.
“Now we’re trying to get a lot of economic growth in that area” Muñoz said, citing several planned city developments.
Muñoz added that if South Azusa had not been redlined, “then we would see a lot more increase in the value and development of the area.”
Updated with video on August 29. Editor-in-Chief James Duffy V contributed to this article.
